
Positive IOD declared, but Australia may avoid its typical dry influence
A positive Indian Ocean Dipole (IOD) was declared this week by the Bureau of Meteorology. While this climate driver usually increases the likelihood of dry and warm weather in Australia, that probably won’t be the case with this event.
What is the Indian Ocean Dipole?
The IOD refers to an index that monitors changes in sea surface temperatures on either side of the tropical Indian Ocean.
Under normal conditions, when the IOD is in a neutral phase, westerly winds flow across the surface of the tropical Indian Ocean towards Indonesia and northern Australia.
When these westerly winds weaken, cooler than normal water starts to build up on the eastern side of the tropical Indian Ocean, near Indonesia, while warmer than normal water emerges near the Horn of Africa in the western tropical Indian Ocean. This pattern is referred to as a positive phase of the IOD.
A positive IOD typically results in less moisture-laden air flowing towards Australia from the northwest, which usually causes below average rainfall and above average maximum temperatures in large parts of Australia during winter and spring.
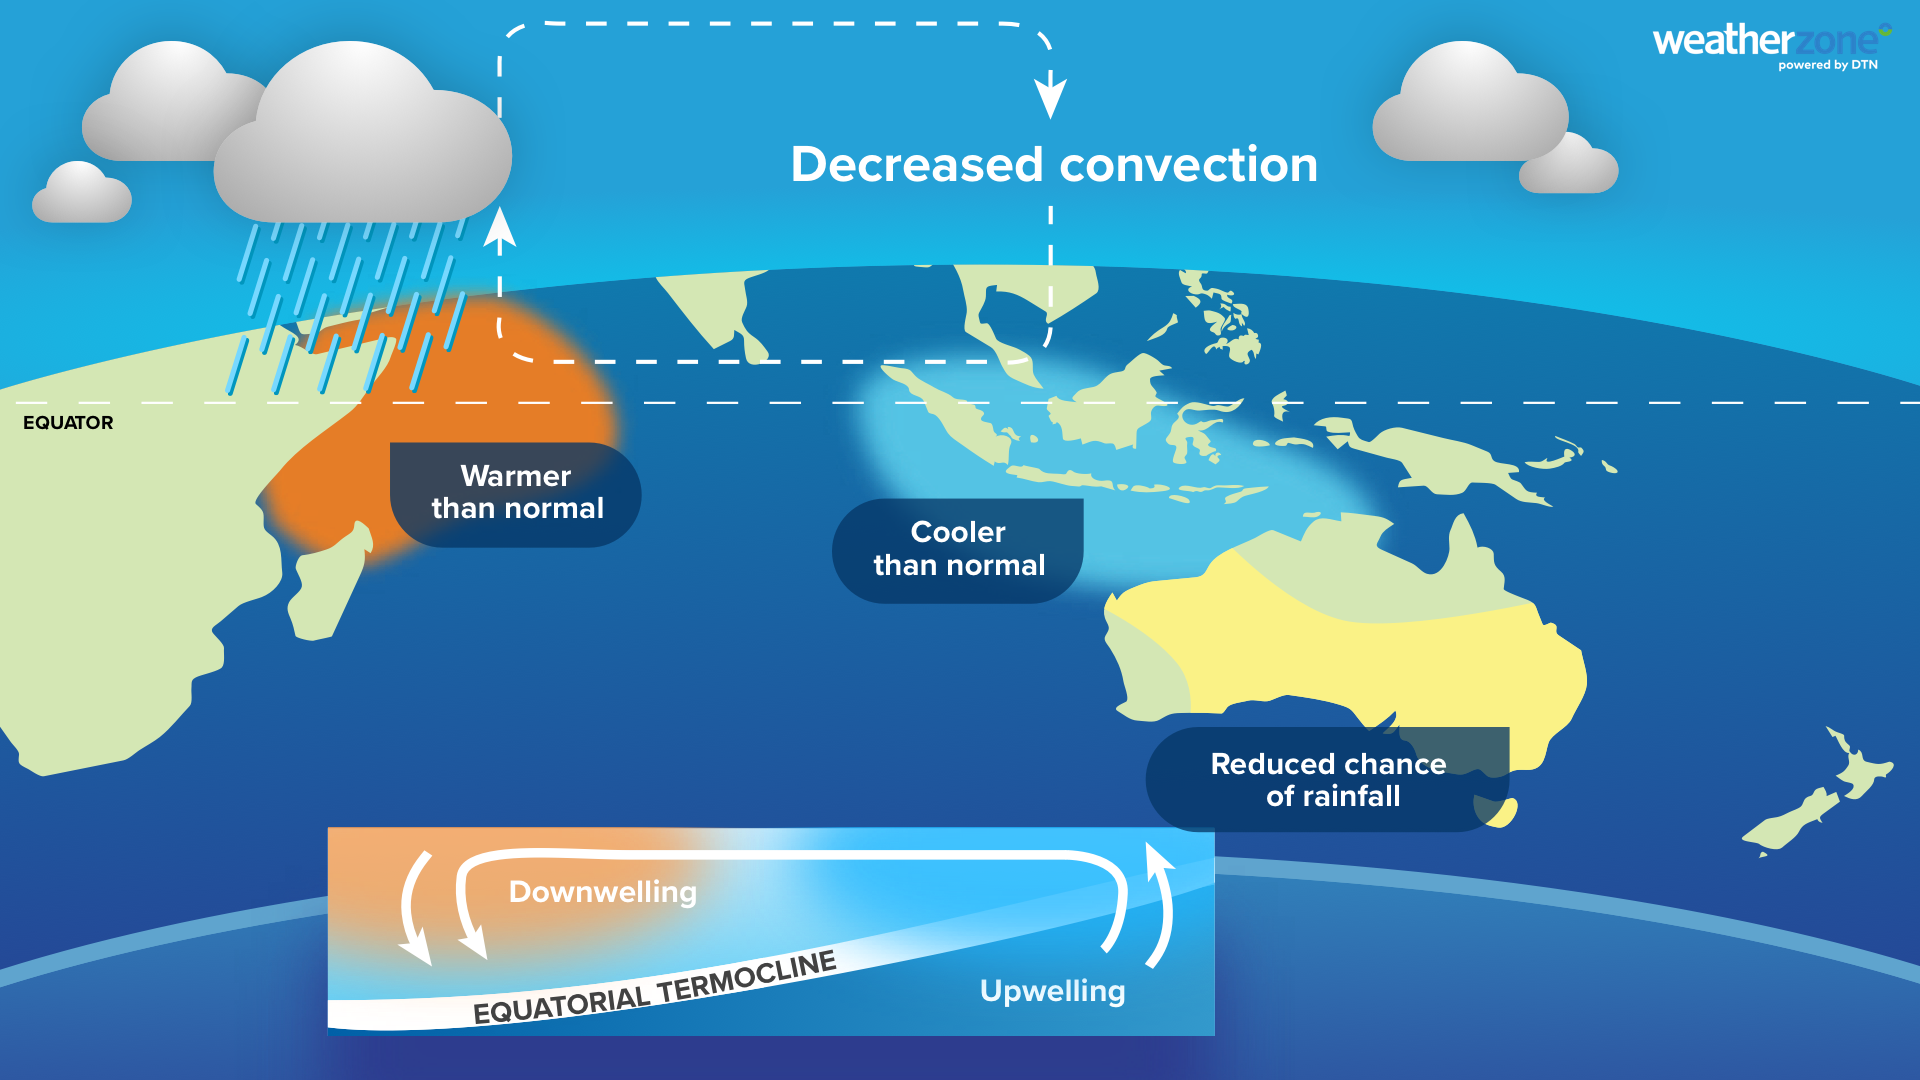
Image: Typical features and impacts of a positive IOD. Source: Weatherzone.
By contrast, when the westerly winds strengthen over the tropical Indian Ocean, warmer water can start to pool to the northwest of Australia, while cooler than normal water develops near the Horn of Africa. This pattern represents a negative IOD phase, which usually causes above average rain and cooler than average daytime temperatures in Australia during winter and spring.
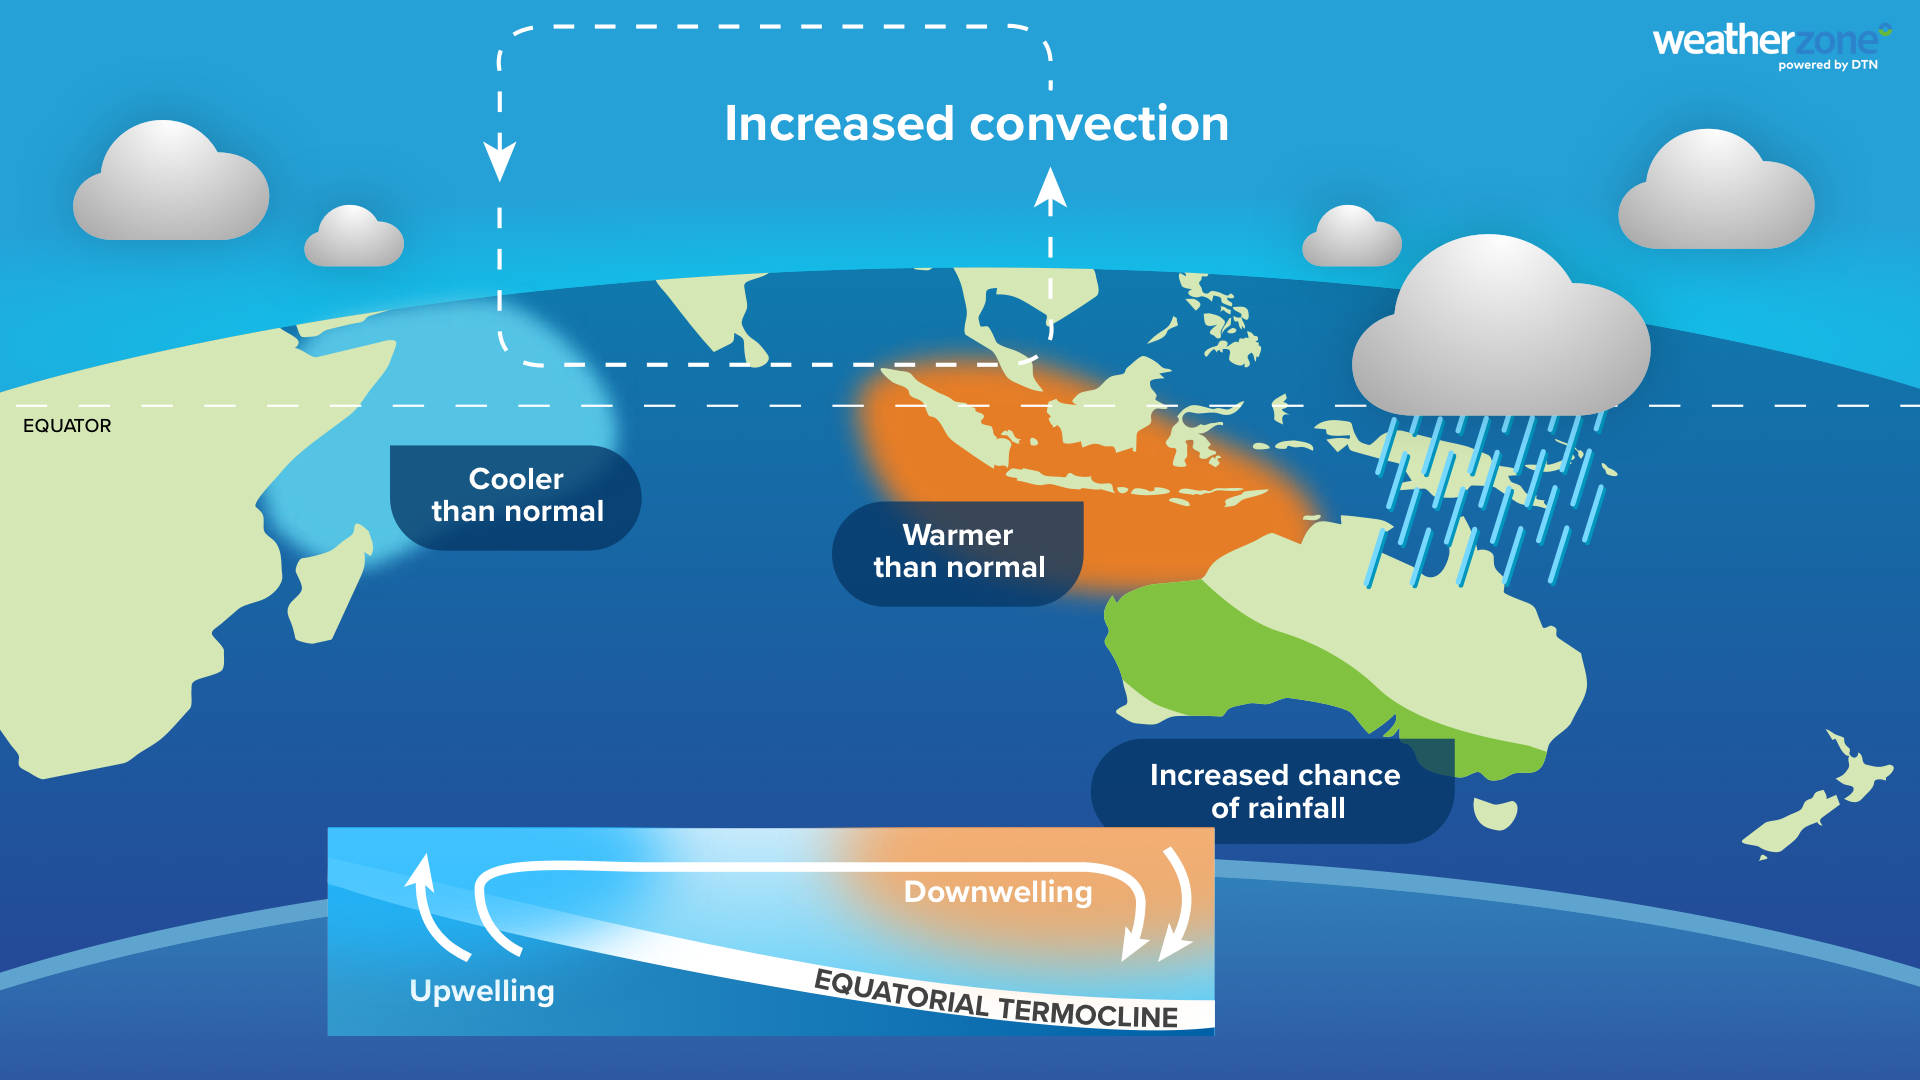
Image: Typical features and impacts of a negative IOD. Source: Weatherzone.
Positive IOD declared this week
The IOD index has been sitting above the BoM’s positive IOD threshold of +0.4°C for the past seven weeks, with the latest value reaching +0.69°C in the week ending October 25. This sustained run of positive values prompted the Bureau to declare this week that a positive IOD is now underway.
Computer model guidance suggests this positive IOD event is likely to persist during the rest of spring and could return to a neutral phase in early summer. This breakdown at the start of summer is also part of the normal lifecycle of an IOD event, which gives credibility to the forecast.
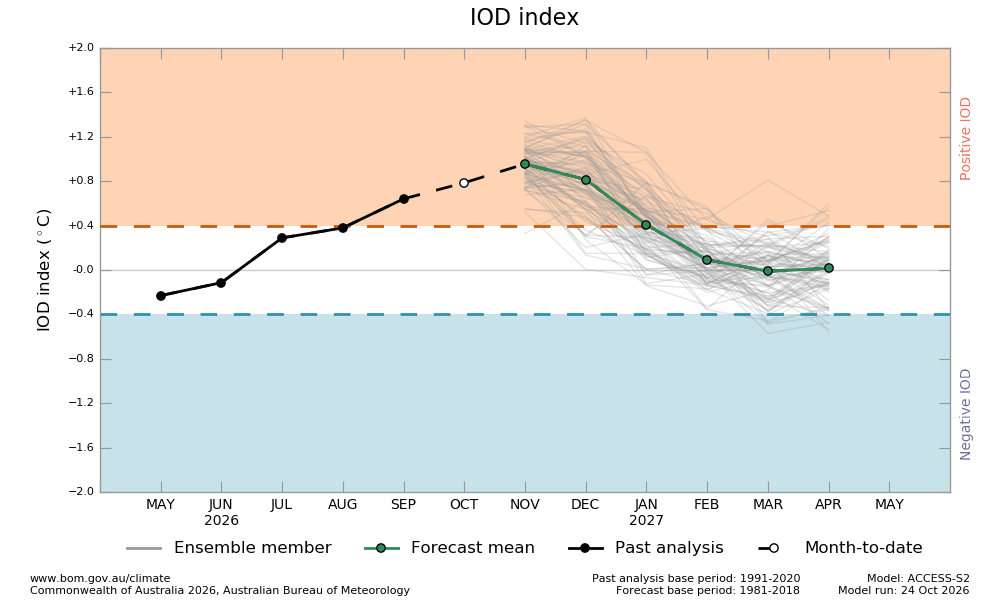
Image: IOD index outlook from the Bureau of Meteorology’s ACCESS-S model. Source: Bureau of Meteorology.
What does this positive IOD mean for Australia?
When a positive IOD is declared, meteorologists typically expect an increased likelihood of below average rain and above average maximum temperatures in Australia during the following months.
However, this event is likely to be different, at least for rainfall.
Current seasonal forecasts suggest that rainfall could be above average over much of Australia in November and December.
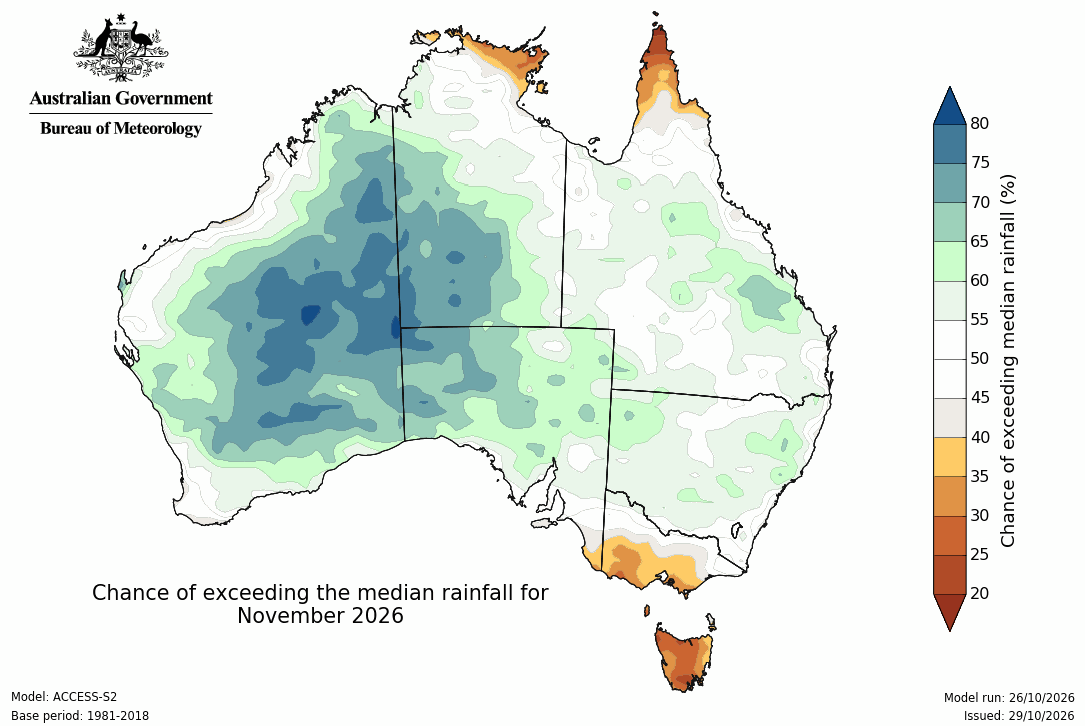
Image: Chance of exceeding the median rainfall during November 2026, according to the Bureau of Meteorology’s ACCESS-S model. Source: Bureau of Meteorology.
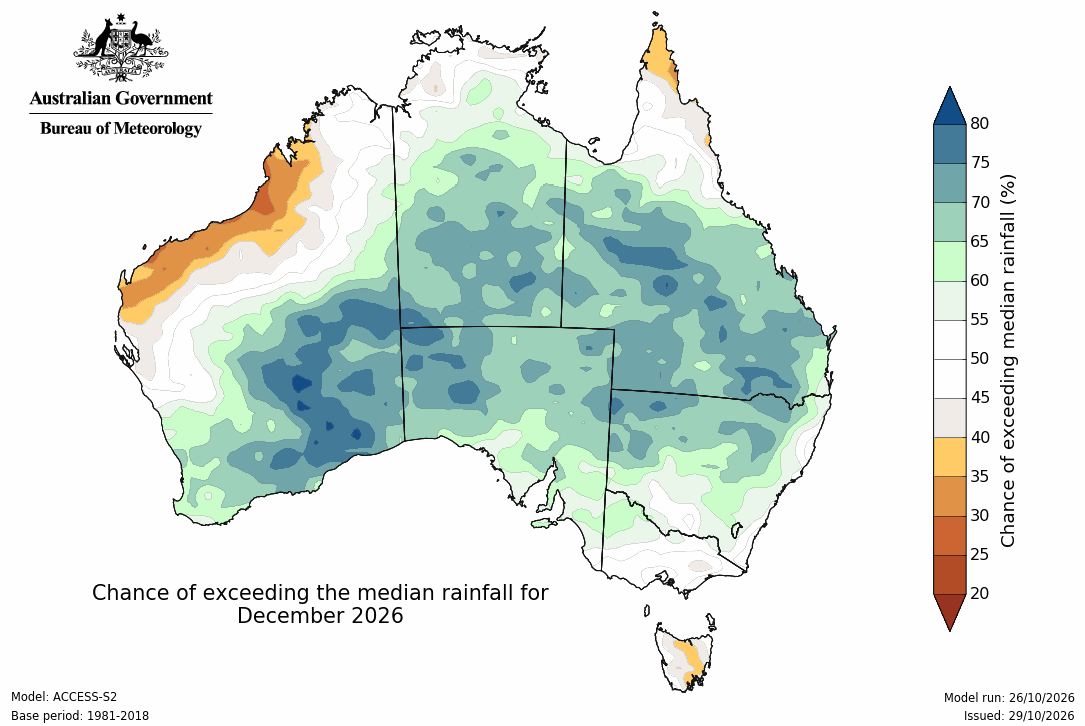
Image: Chance of exceeding the median rainfall during December 2026, according to the Bureau of Meteorology’s ACCESS-S model. Source: Bureau of Meteorology.
The maps above show what one computer model is predicting in terms of rainfall for the next two months. The maps below shows what rainfall impacts typically look like during a positive IOD.
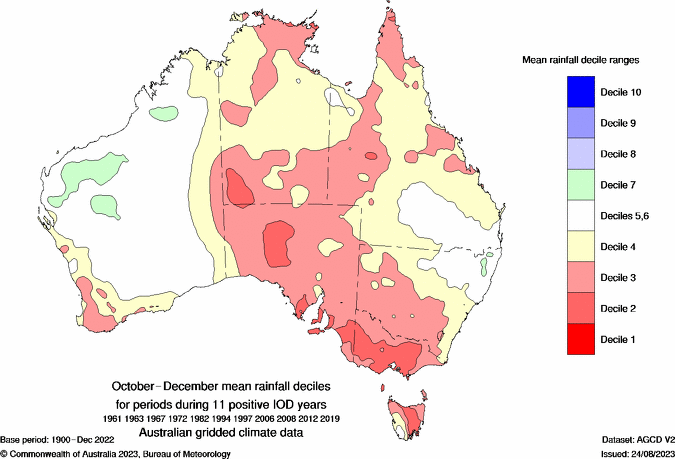
Image: Mean rainfall deciles for the October–December period during 11 positive IOD events between 1961 and 2019. The red areas show where rainfall was below normal for this period.
Over the next couple of months, rainfall is currently forecast to be higher than average over large areas of Australia, including regions that are typically drier than usual during a positive IOD.
Why could this positive IOD be wetter than expected?
One of the main reasons for the wet seasonal outlooks despite a positive IOD is a large region of warmer than average water in the south–central Indian Ocean, sitting just south of the IOD monitoring regions.
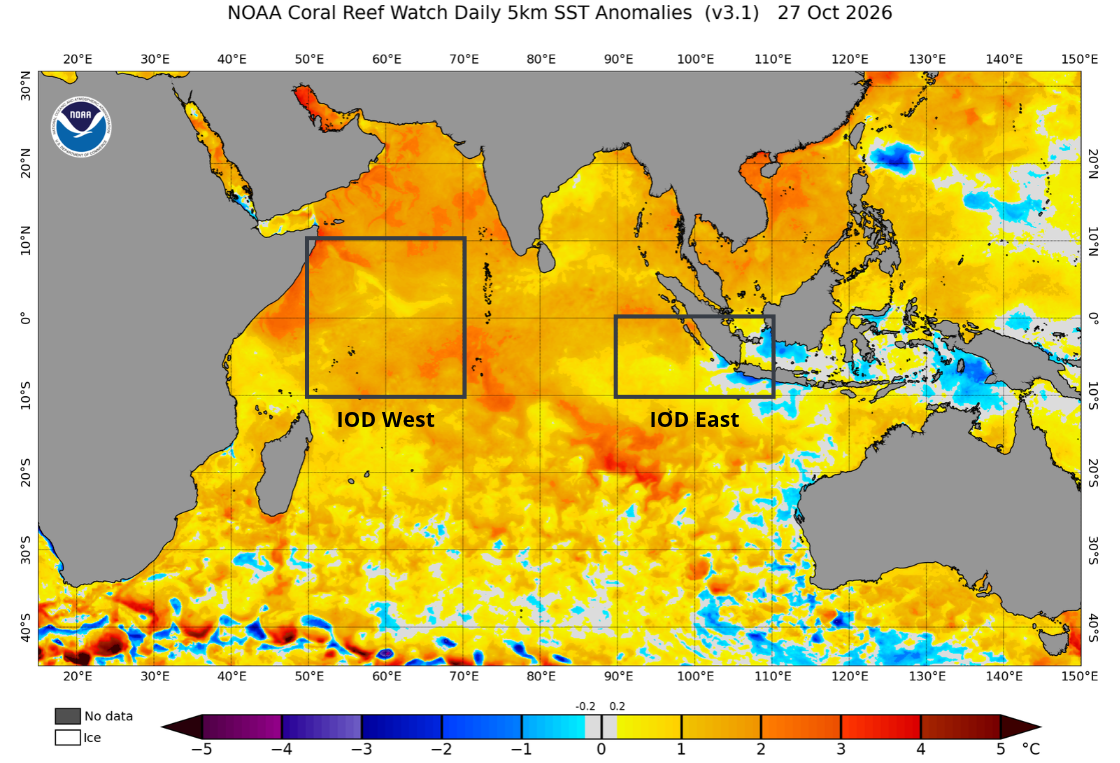
Image: Sea surface temperature anomalies on October 26, 2026, showing a large area of warmer than normal water just south of the tropics and outside the labelled IOD monitoring regions. Source: NOAA.
The abundance of warmer than average water at the surface of the Indian Ocean is enhancing evaporation and adding more moisture to the air. This moisture can then be transported towards Australia by westerly winds, cold fronts and other passing weather systems. This may be helping offset some of the drying influence typically associated with a positive IOD.
It’s important to point out that the positive IOD is still expected to influence rainfall in the Australian region in the coming months, although it’s strongest impacts may be to the north of the country. This dry influence will also be enhanced by El Niño in the tropical Pacific Ocean.
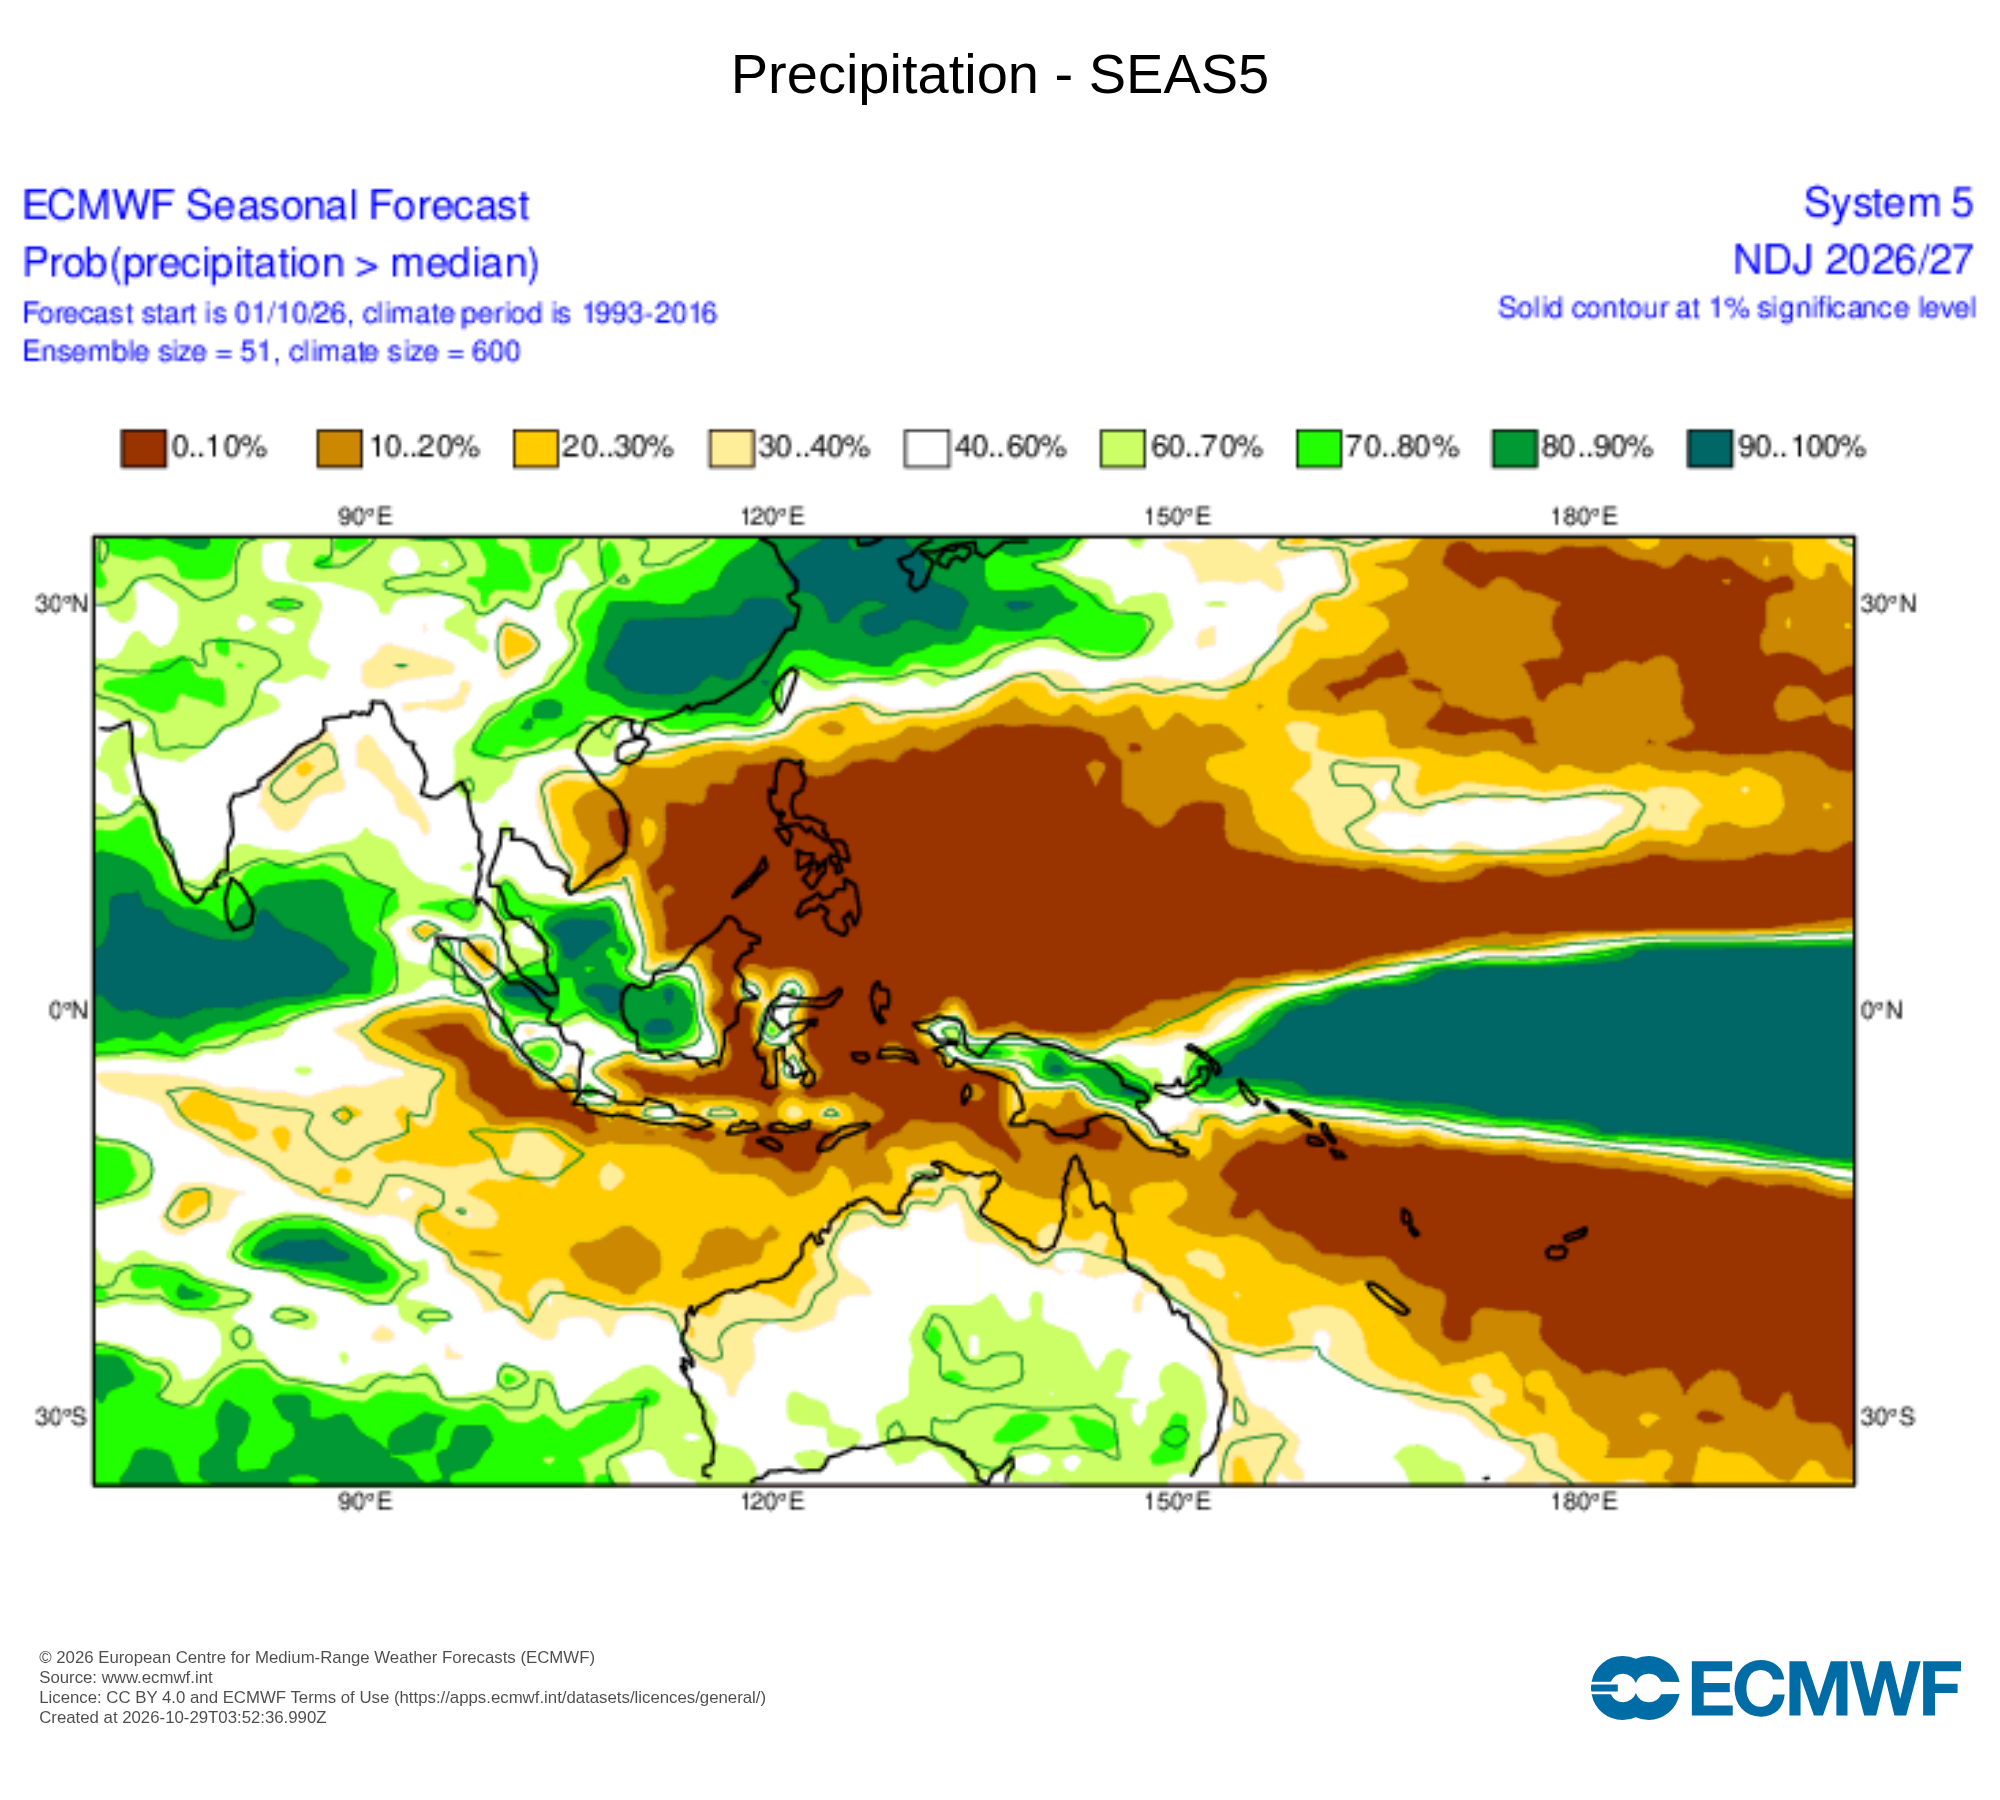
Image: Chance of exceeding median rainfall during November 2026 according to the ECMWF SEAS5 model. Source: ECMWF.
Positive IOD warmth more likely
While rainfall could defy the typical positive IOD trends during the coming months, daytime maximum temperatures will probably be above average for much of Australia in November and December, which is in line with the expectations of a typical positive IOD event.